Friday, November 20, 2009

Streamflow Prediction


1)Selection of existing rainfall and streamflow gaging station in Florida
2)30 mile buffer around the prediction point for identifying streamflow gauging stations in the vicinity in the same or nearby watershed
3)8 streamflow gauging stations selected in the nearby areas for the daily streamflow forecasting at a given location.
4)Identification of second location for streamflow prediction
5)Buffer for the location 2
6)Best gaging stations obtained for the location 2 by the process of optimization
7)Spatial Interpolation: Prediction of the missing streamflow values using Spatial interpolation (IDW) in ArcGIS. The results were validated using test data (red star marked on the map).

Sunday, July 19, 2009

Week 10: HomeLand Security: Protect

Deliverable 4: 3-D Line of Sight Polylines in ArcScene, revealing how terrian relief obstructs the range of view from that designated surveillance position. The extend of line of sight polylines over the surface is shown here.
Deliverable3: Al map showing series of observation points where surveillance camera can be deployed to oversee the operations and activites before, during and after an event. Also, a line of sight profile graph of the represenatitve observation point is shown. The profile graph provides a perspective of line of sight as if one is observing it from the ground. It provides a better look at where the view may be claer or obstructed.


Deliverable2: These are secure ingress and egress routes around Alta Bates Medical Center (a critical infrastructure). The red points (position) on the map are the optimal locations for increased security to monitor ingress and egress to the hospital sites.

Deliverable 1: A map showing buffer zone surrounding each of the hospitals within the larger buffer zone.


Wednesday, July 15, 2009

Week 9: GIS for Homeland Security:Prepare

Deliverable 3: Screenshot of 8 layers in the table of content

Deliverable 2: Significant landmarks in BAUA


Deliverable 1: DHS Bay Area Urban Area (BAUA) Boundaries

Tuesday, July 7, 2009

Crime Analysis: Houston Crime


Deliverable 1: A base map showing Houston crimes, Police Stations and roads.

Crime Analysis: Houston Crime


Deliverable 2: A map with police stations and locations of crime. Also, a graph showing the number of crimes for each police station.

Crime Analysis: Taking a bit out of Houston's Crime


Deliverable 3: Density Maps showing burglary, Aggravated Assault and Narcotics related crimes in Houston, TX (August 2006).
Deliverable 2: A map with police stations and locations of crimes. Also, shown is a graph indicating number of crimes for each Police Station.


Wednesday, July 1, 2009

Module 7: New School Site (On your own Project)

Deliverable 3: Weighted Overlays with pros and cons

Deliverable 2: Map with location targets parameters: Distance from school1; distance from school2, % population of a kids age 5-17; Distance from residential area (new development)

Deliverable 1: Base Map of Saint Lucie County, FL

Tuesday, June 23, 2009

Module 6: Location Suitability Analysis

Deliverable 3: Weighted Overlay (I & II) Maps with pros and cons discussed for selecting the best home site for the couple.

Deliverable 2: Location suitability Parameters maps: Distance from CR Hospital, Distance from P College, Census tract with % of people 40 -49 and census tract showing median house values


Deliverable 1: Basemap for Maricopa county, Arizona

Monday, June 15, 2009

Week 5: Impact Assessment

Deliverable 1: EIA for siting a building in Pewter City
Deliverable 2: A social identity map depicting university student residency

Deliverable 3: A location quotient analysis of the Pewter City region


Deliverable4: Visual Assessment of a Proposed building development


Monday, June 8, 2009

Week 4: Floods Deliverables

Deliverable 2: Map showing the parcels affected by 1993 floods. Also, a graph incorporating the economic loss (Total Land value) is shown. Total land value is also indicated through parcel symbology.
Week4, Floods, Deliverable 1: Flood Hazard Map of the Maplewood subdivision


Tuesday, June 2, 2009

Week 3: Hurricane Damage Deliverables 2 & 3 (combined)

Deliverable 2 & 3 combined : A map of flooded land of the Mississippi Coast after Hurricane Katrina; and a bar graph showing percentage of total flooded land by land cover type .

Hurricane Katrina Damage Deliverables


A map showing elevation, hydrography and bathymetry of the Mississippi coast counties with places, types of water, barrier islands and hydrography.

Sunday, May 24, 2009

Earthquake


This is a case study of earthquakes in Central Mississippi valley, near Madrid, Missouri. Mapping worldwide earthquake locations in relation to plate boundaries. Identifying high level seismic activity areas, occurrence of largest earthquakes, Tsunami affected counties. Critical infrastructure, facilities and lifelines in the hazard zone and probable effects on the population. Visualizing earthquake data in 3D using ArcScence. Mapping and analyzing building damage patterns, comparing and contrasting it with geology, liquefaction potential, and PGA and PGV values throughout the region. Spatial and temporal distribution of aftershocks.

Thursday, April 23, 2009

Ruffed Grouse Habitat


The map shows Cloquet Forestry Center with areas of high potential for ruffed grouse habitat identification. The size of prime ruffed grouse (Bonasa umbellus) habitat is estimated.

Friday, April 10, 2009

Raster Analyses


The road construction cost in an area is identified by calculating the cost surface based on raster and vector data layers. Cost surface is calculated depending upon the slope and distance to the existing roads. Spatial Analyst extension (Raster analyses) is used in the process.

Thursday, April 2, 2009

Cartographic Modeling


This map uses overlay union on the the road and water layers (buffer layers created in the previous map)for identifying potential campgrounds sites for the Desota National Park.


Here buffering operation of cartographic modeling is applied. Fixed distance buffer is used for the roads and variable distance buffer is used for water. Buffering operations are created for Desota National Park in Southwest Perry County. It is using Arctoolbox, analysis tool, proximity.

Wednesday, March 18, 2009

One to Many Joins


This is one to many joins as many records in the layer's attribute table join to the same record in the table of soil type descriptions.

Joining Two Existing Tables


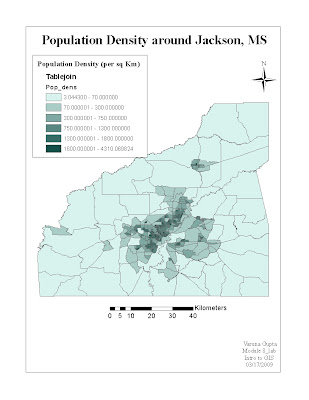
The exercise uses the table operations in ArcGIS. It uses the joins and relates for joining two tabular data files. It combines the demographic table to the mapped data in the block group layer. This is one to one join.

Monday, March 2, 2009

Manipulating Digital Data, NWI and DEM data


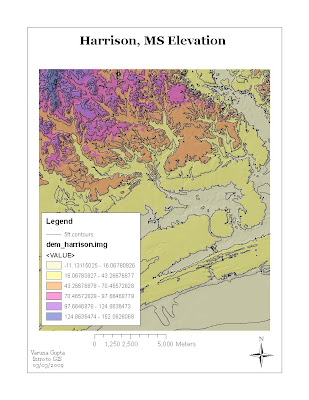
The above map is DEM with contour lines and hillshade. This exercise involved the manipuating of USGS 10 m DEM for study area ,Harrison. It used Spatial Analysis Extension.


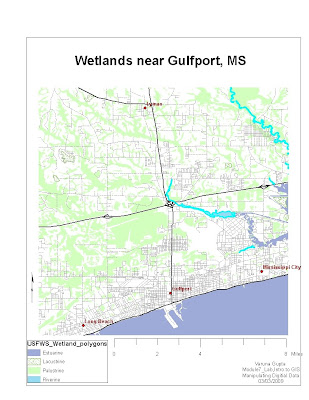
The map is the outcome of operations performed on the digital data obtained from the National wetland Inventory (NWI) developed by U.S Fish and Wildlife services. The map displays the wetlands and deepwaters habitats classification system. The exercise involved creating of new field in the attribute data, editing and reclass wetland system which is more easily interpreted.

Thursday, February 26, 2009

DO Rates_GPS sample points


It is a graduated quantity map indicating the dissolved oxygen rates in Escambia County, Florida. The spatial data for the county and GPS sample data points is used for creating the map. GPS samples data points (file saved as .csv) are imported as table as X,Y data in ArcGIS and converted into a feature class.

Tuesday, January 27, 2009


Mississipi Map is projected using three different projections. In addition, the comparison of these maps are done by calculating the areas of the three maps. Editor toolbar is used in the process for calculating areas.
The different projections not only have different absolute areas but also the general shape of the state changes with each projection.

Thursday, January 22, 2009

Wetlands for the Gulf Coast near Biloxi, MS

The map indicates the types of wetlands in Gulf coast surrounding Biloxi in Mississippi.

Base map for Hattiesburg, Mississippi